UX Design • Prototyping
Driving Insights —Visualizing Harsh Brakes
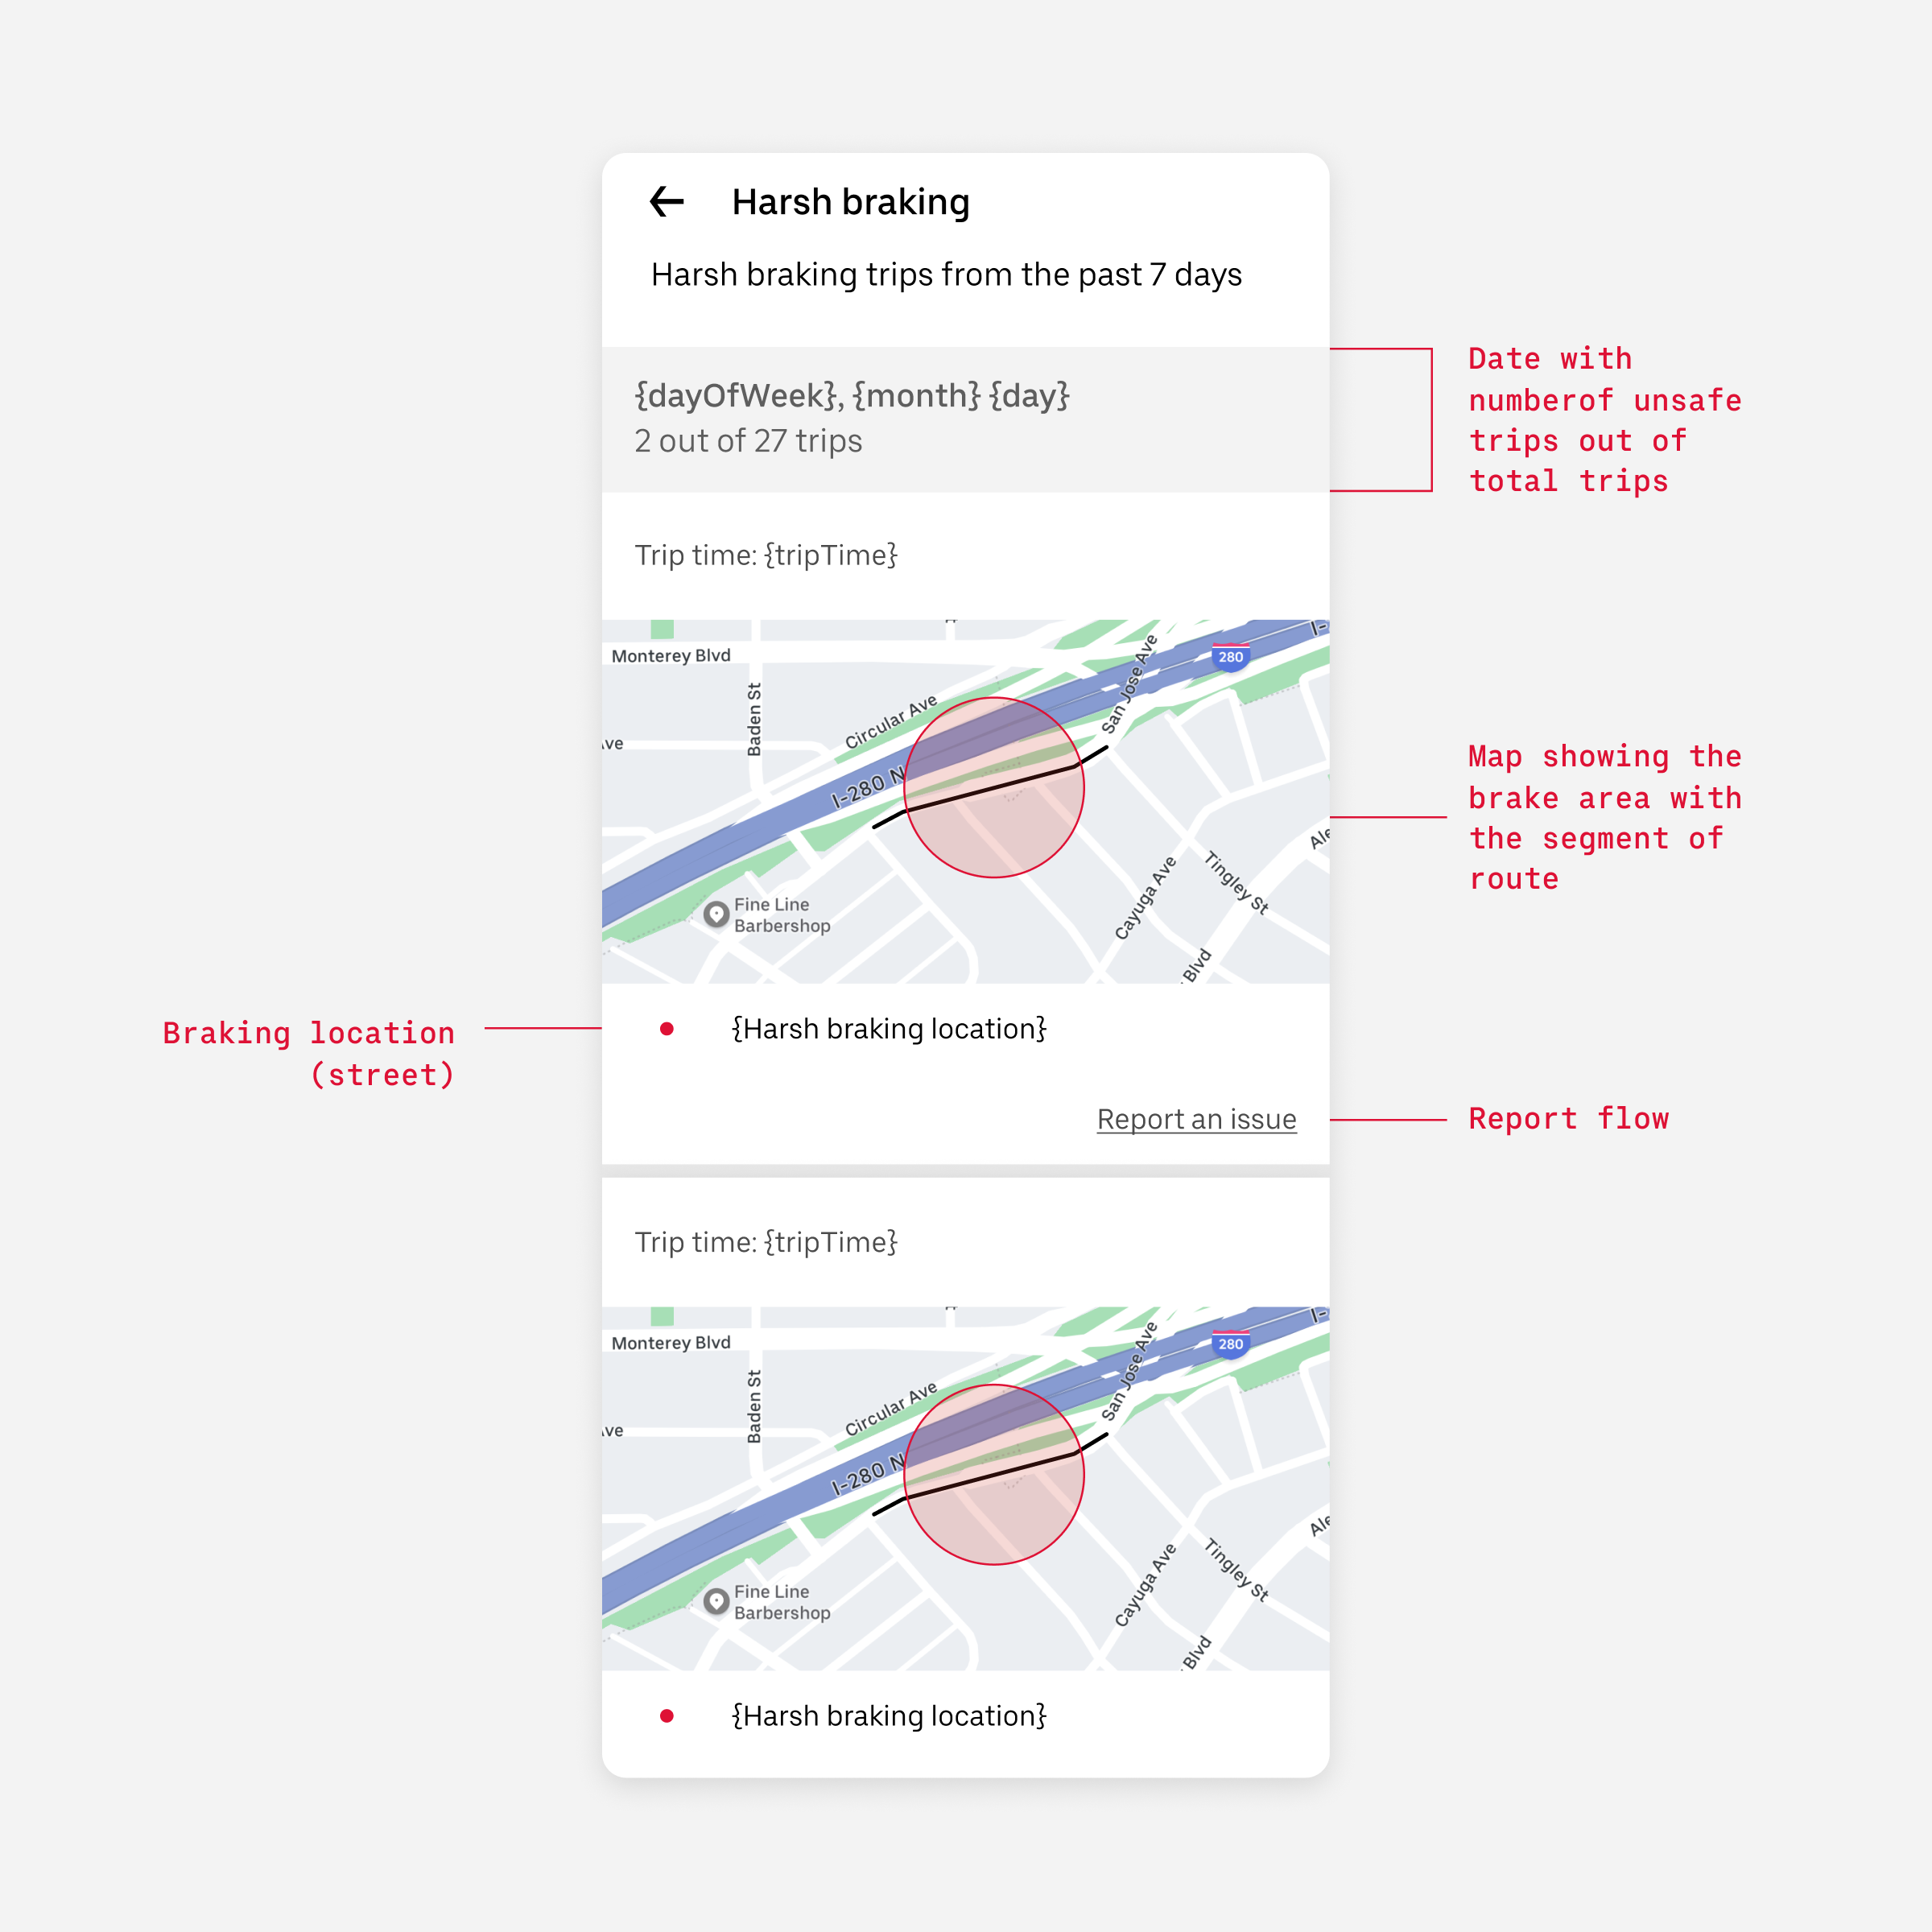
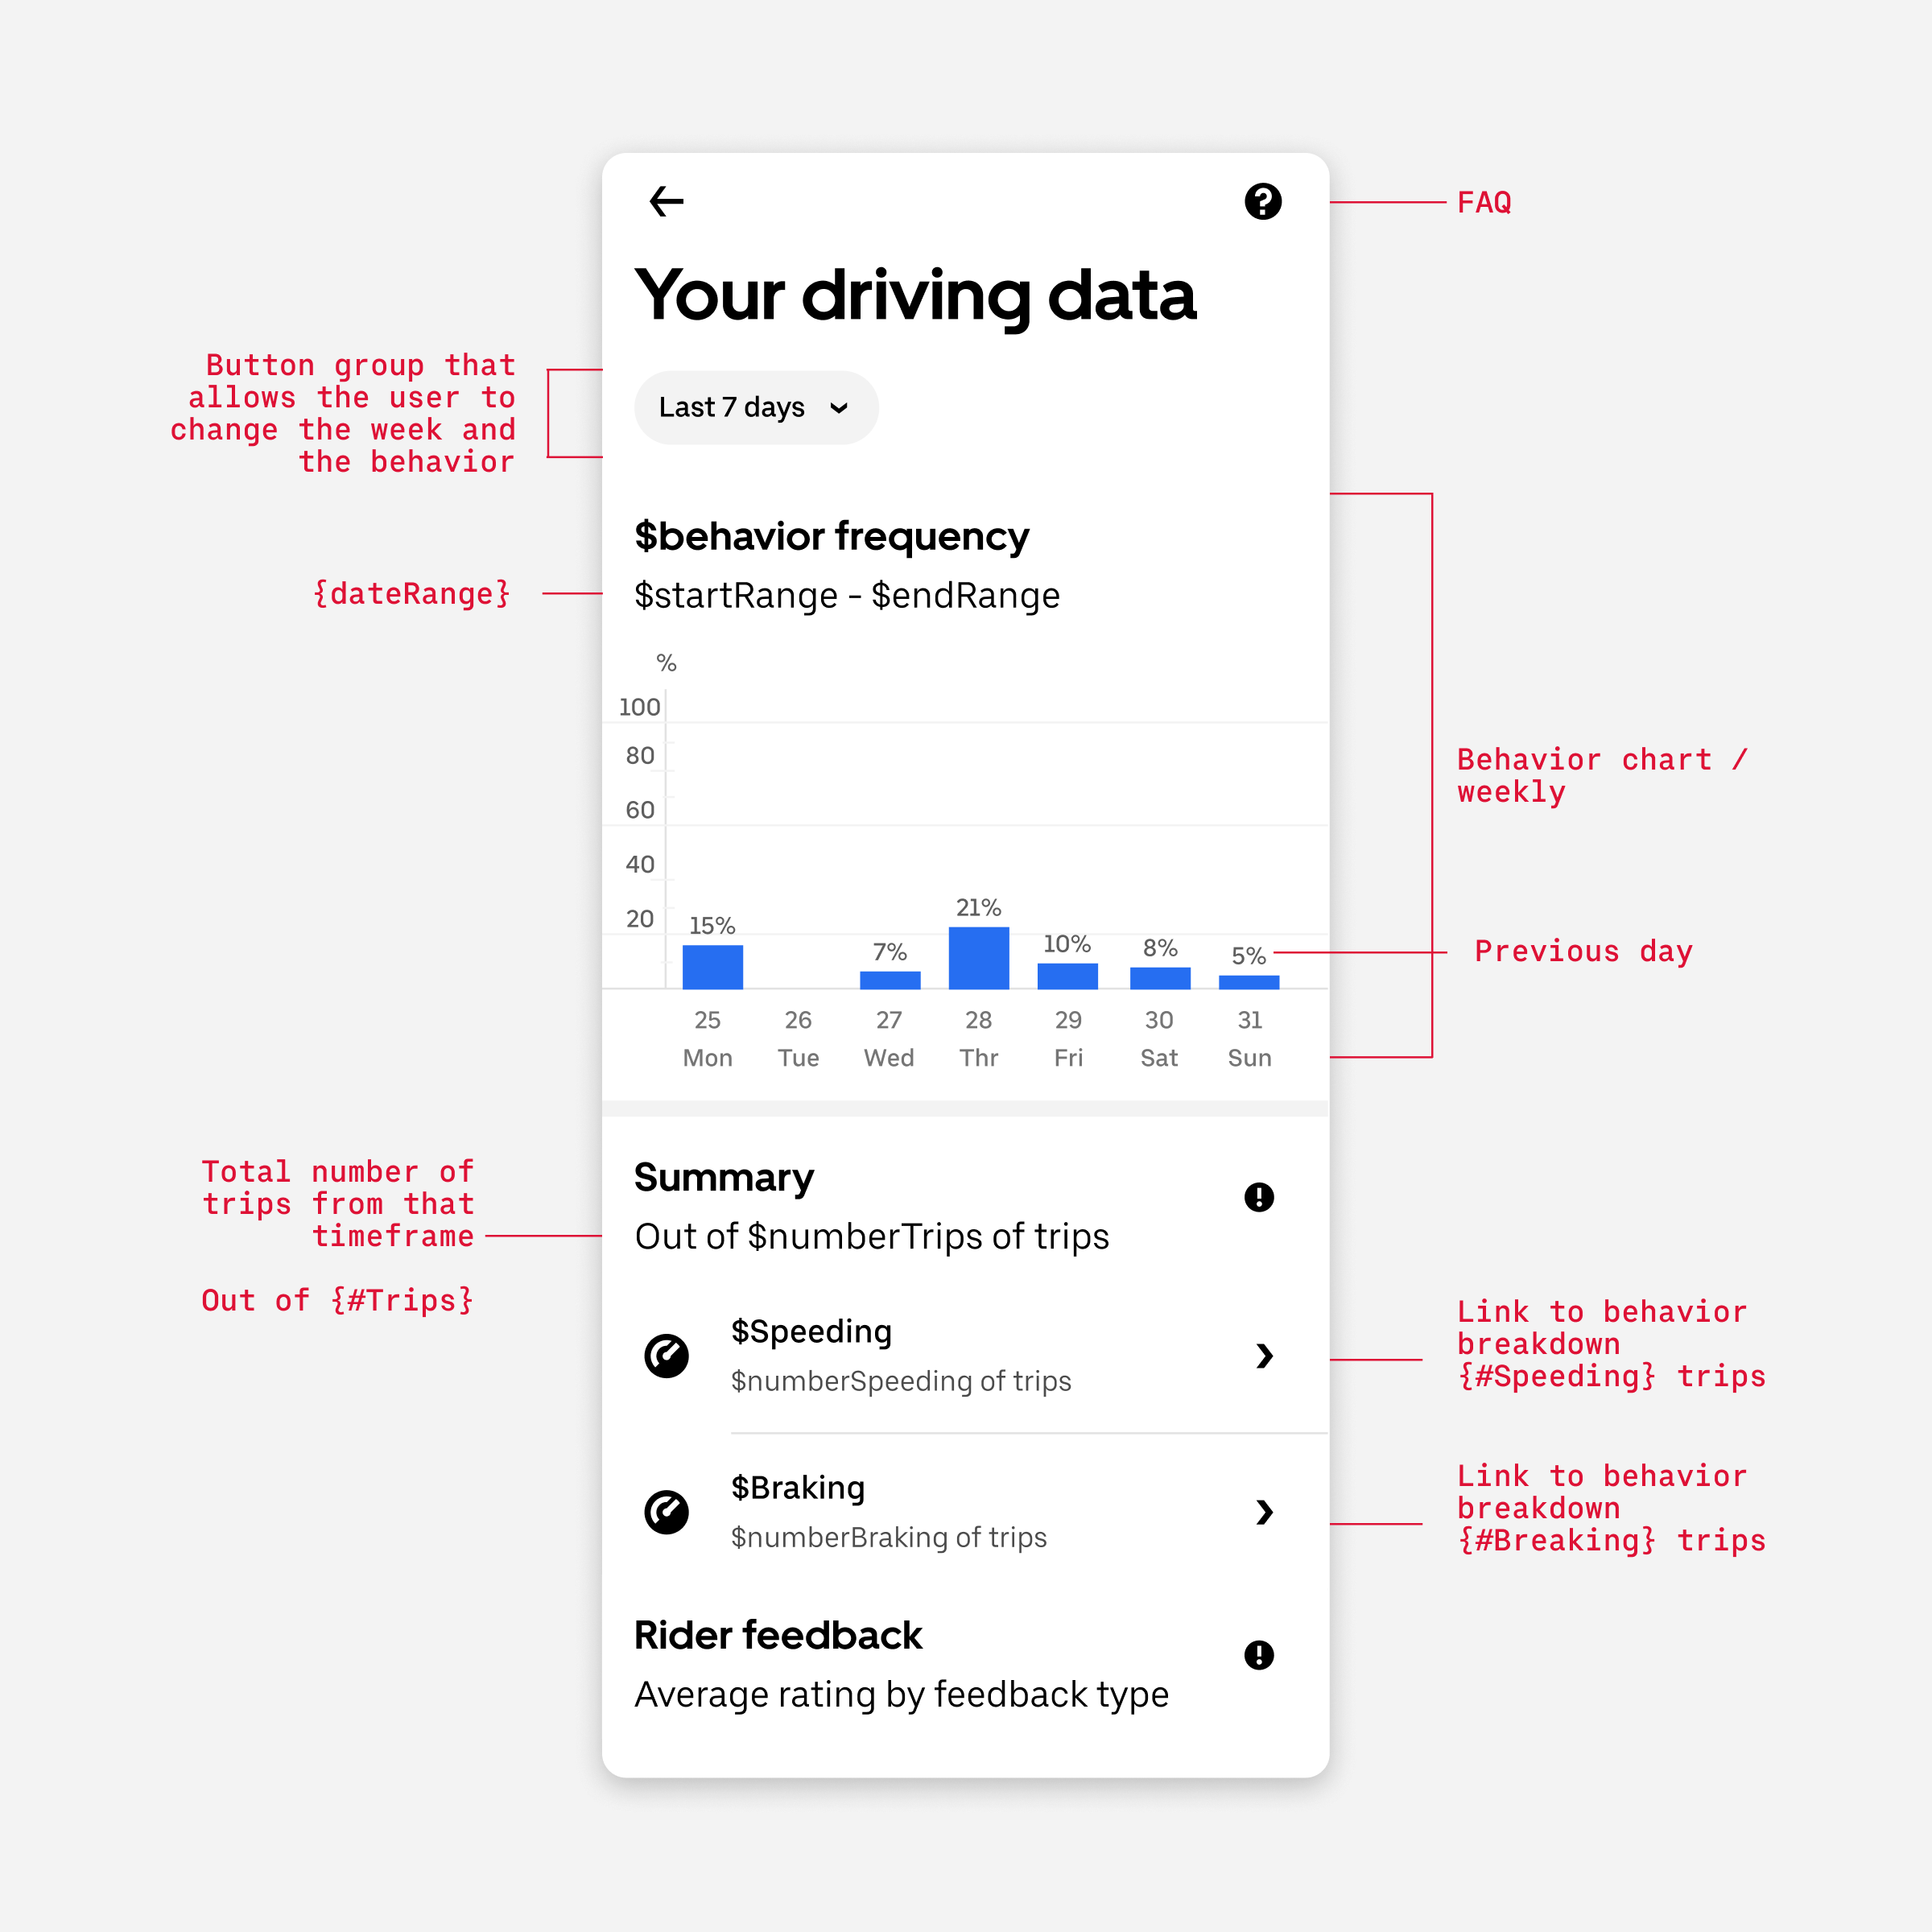
The driving insights project is a way for Uber to provide drivers who engage in dangerous driving behaviors a way to see this data visualized to track behaviors and inspire change. This was an MVP project that went on to become more robust on the Uber Earner app (app that drivers use). For this case study, I only discuss harsh brakes as that is the feature I owned.
Team
Uber Safety Team
Domains
Android mobile, IOS mobile
Role
One of two designers
Year
2022
Context
Dangerous driving and safety incidents have increased exponentially as the pandemic restrictions were lifted.
Problem
We’ve observed that dangerous driving notifications do not provide actionable feedback, which reduces the ability for drivers who receive these notifications to change their behavior.
Opportunity
Solution
How might we empower earners change their behavior and prevent deactivations?
Well designed feedback loops fueled by data to inspire change!
Considering scalability
An important consideration for this project was ensuring the design was scalable as this was just the MVP. Additionally, speeding insights already existed on the platform so I had to ensure my work was also consistent with the work of a different designer on the team.
My approach
I identified key areas that required deeper research. This led to discussions with user researchers, product managers, data scientists, and engineers to ensure informed and impactful designs.
Key areas
User problems
Understand user perception of historically done initiatives and understand the current experience to mitigate dangerous driving.
Understand the landcape
What is feasible
When does a normal brake turn into a harsh one? We always brake when we drive, sometimes in order to avoid a dangerous situation, so at what threshold does a brake become dangerous.
What type of data do we have, what can we show a user and what is not feasible or legal? With our time limit what is possible to complete.
Impact
Of the top 40% of harsh brake offenders received a driving insight notification, and we saw a 7% decrease in harsh braking.